
Analytics
How much work agents did in a project, and the tokens and cost behind it
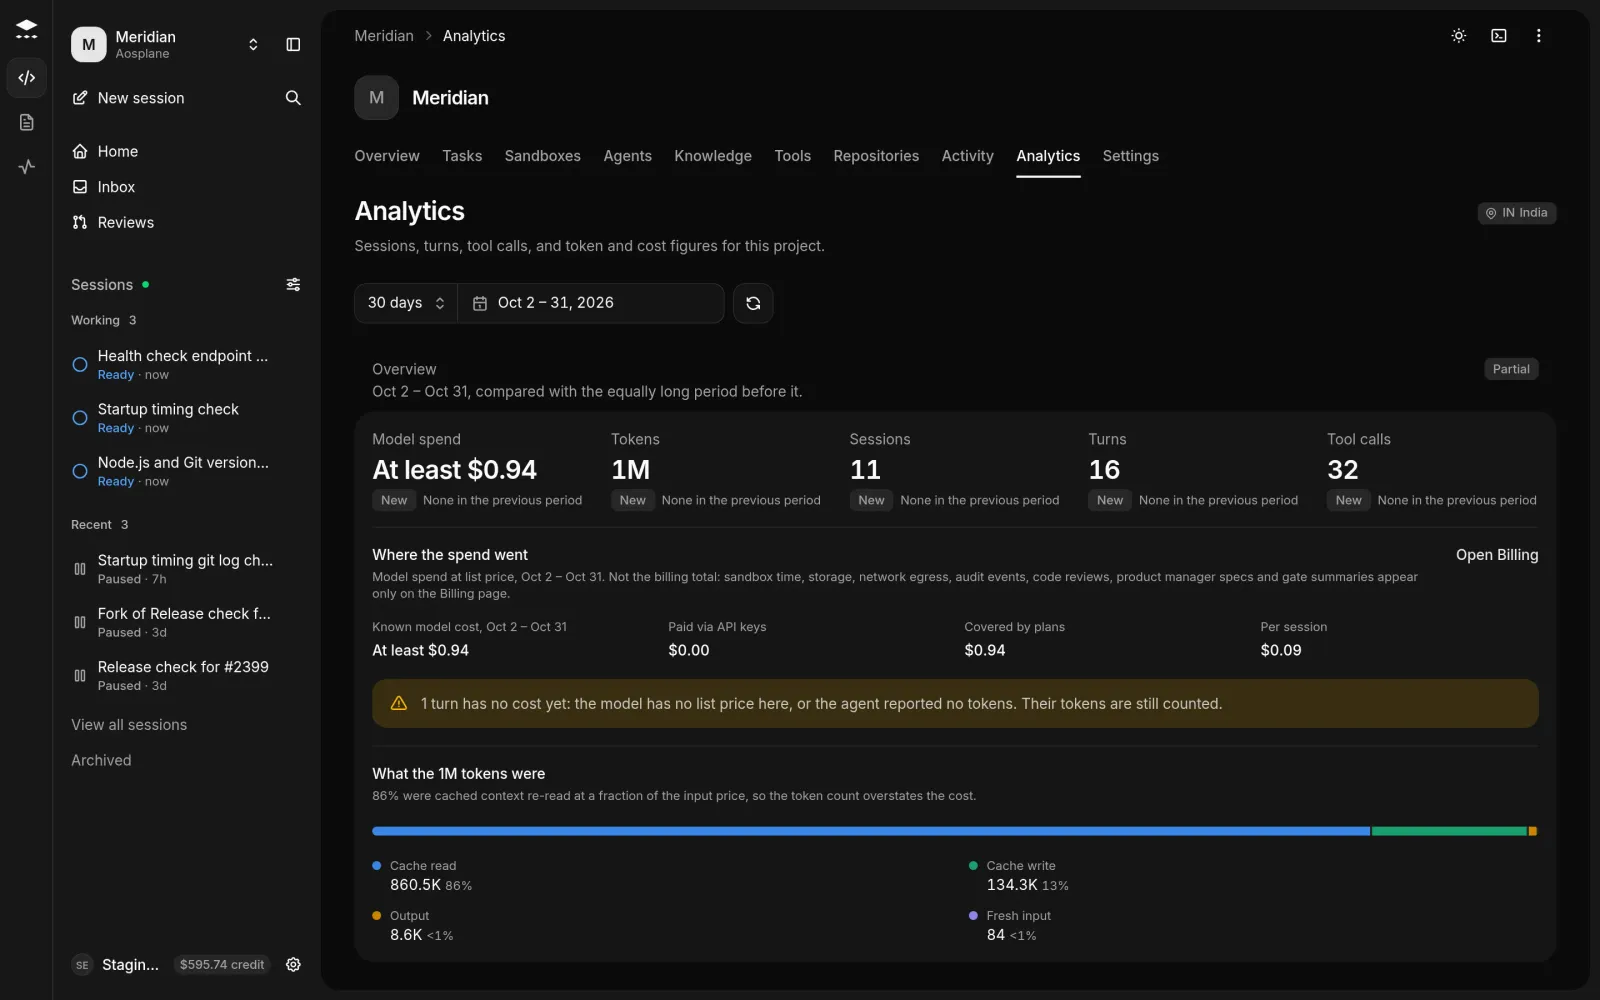
Analytics shows how many sessions ran in a project, how much the agents did, and what the model calls cost. Use it to spot a spike, compare coding agents, or find the session behind a big bill. Everyone in the project can see it.
Check a project’s usage
Pick a period
Choose 24 hours, 7 days, 30 days (the default) or 90 days, a calendar period such as This week or Last month, or your own range of up to 366 days.
What else is on the page
- Usage trend: Activity over time per agent, by Tokens, Tool calls or Cost. Show as a table shows the same numbers.
- Breakdown: rank the Agents, Models and Tools behind the activity.
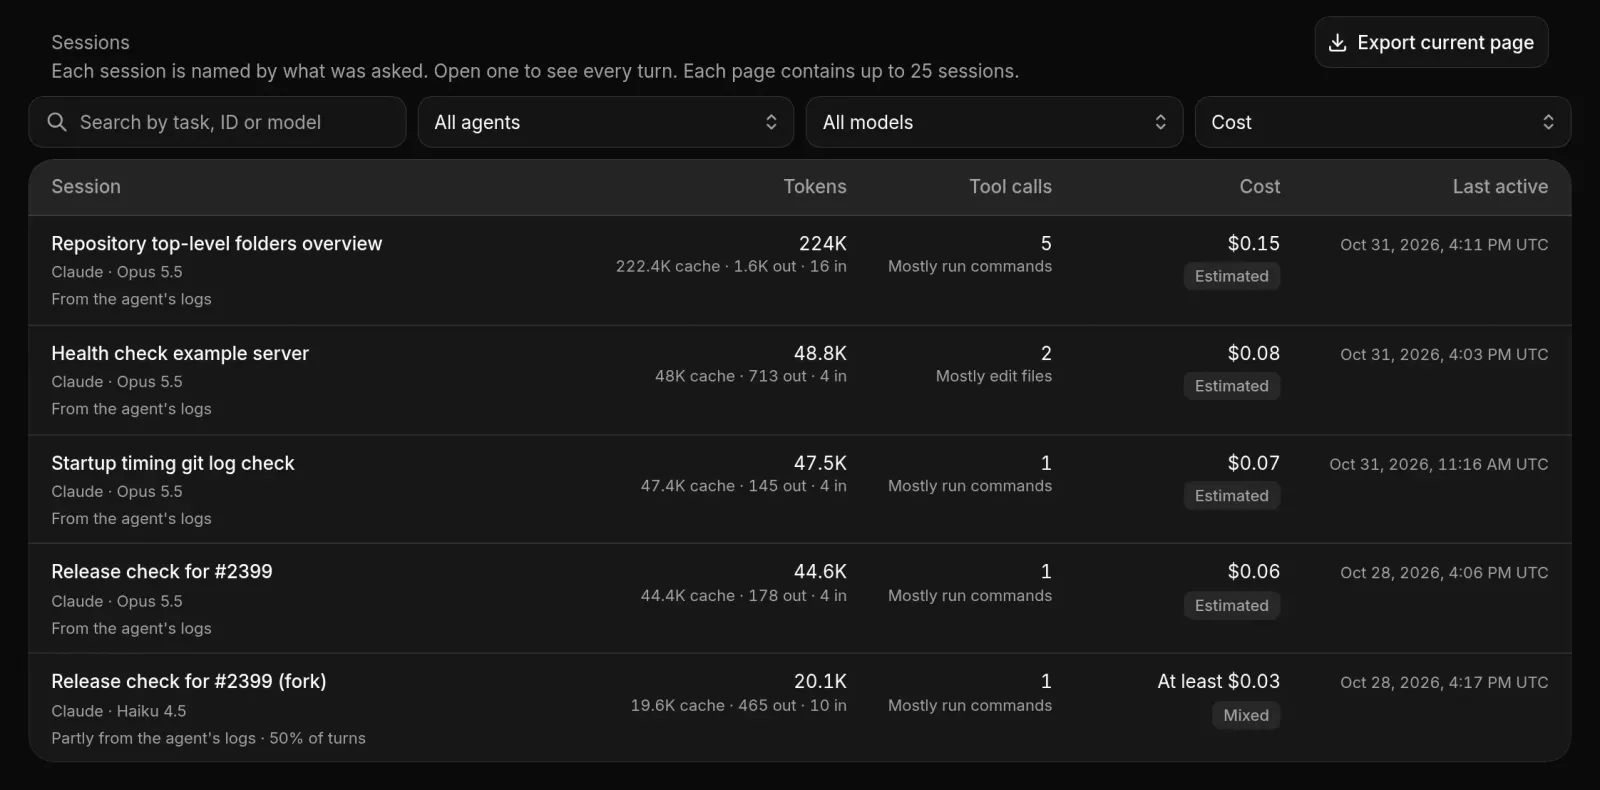
- Sessions: 25 per page, each named by what was asked. Export current page downloads the page as a CSV file.
- Data quality: How these figures were measured. Choose Details to see how many turns came from Agent logs, Agent report or Not measured.
Good to know
- Sessions, turns and tool calls are always counted. Tokens and cost appear only when the agent reports them, so they can be incomplete. At least before a cost means some turns had none.
- Costs are list prices for understanding usage, not your bill. When an agent reports no cost, AOSplane estimates it from public model prices. For what you’re billed, choose Open Billing.
- Covered by plans is the list-price value of tokens a Claude or ChatGPT plan paid for.
- Days follow your browser’s time zone. The refresh button loads the latest figures.
- For usage across every project, choose Usage details on Home.